Does one size fit all? The varying carbon footprints of different types of UK households
Overall aims
One of the challenges faced by policy-makers in the transition to a sustainable energy economy is the need to understand the empirical links between people’s consumption patterns and their carbon emissions. It is, perhaps, obvious that some segments of UK society have a higher carbon footprint than others, but what are the key factors that produce the differences? And what is the extent of the disparities? In this study we investigated the carbon footprints of different types of UK households.
Methodology—SELMA and LARA
This study used two models developed within RESOLVE: ‘SELMA’ and ‘LARA’. SELMA is the Surrey Environmental Lifestyle MApping (SELMA) framework. This framework estimates UK carbon emissions at a national level using the consumption perspective. In the consumption perspective, upstream carbon emissions that arise in the production and distribution of goods and services are attributed to final consumers. An important aspect of this perspective is that it takes into account all emissions incurred in support of consumption within the UK, whether the emissions occur in the UK or abroad.
In order to explore the emissions attributable to the various types of households in different neighbourhoods, SELMA incorporates that Local Area Resource Analysis (LARA) model. LARA uses data from the Census to add socio-demographic and local geographical detail.
Results
Our results show that the carbon footprints of different UK socio-economic groups vary widely, and although income is a key indicator, other factors also have significant influence.
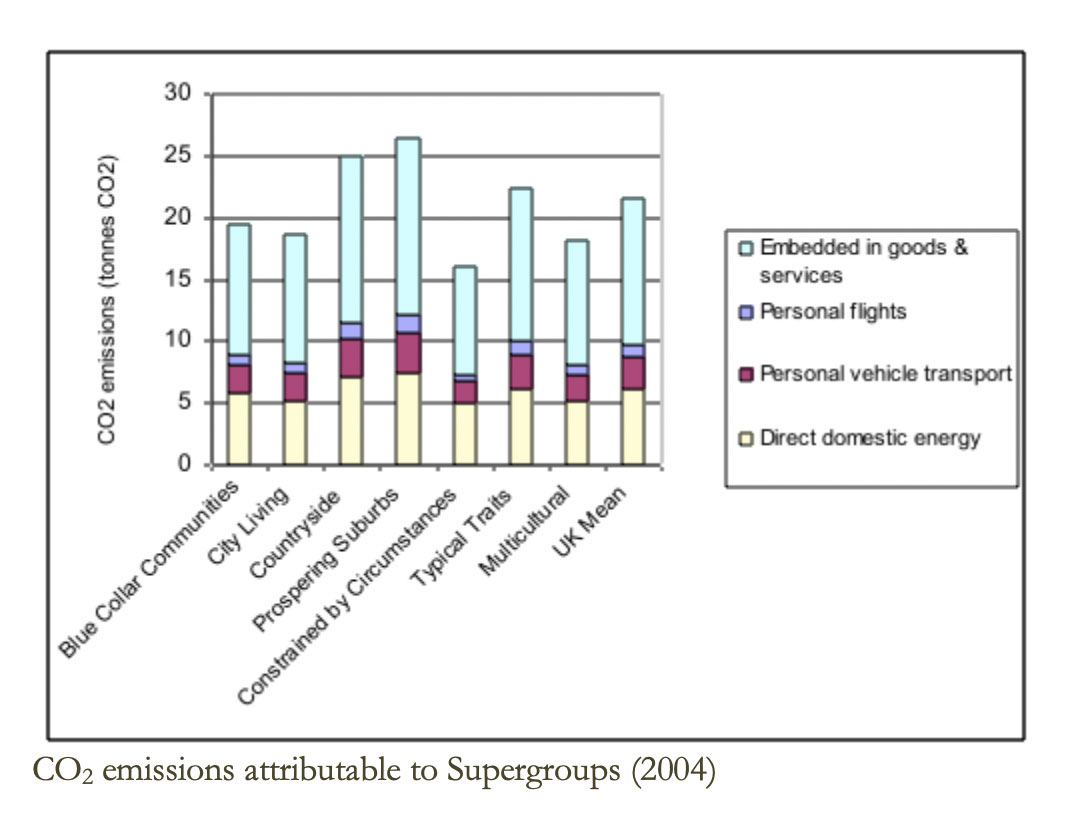
The graph shows results for seven ‘Supergroups’. Households in the most affluent Supergroup (Prospering Suburbs) are responsible for 64% more carbon than those in the least affluent Supergroup (Constrained by Circumstances). In particular, Constrained by Circumstances has the lowest emissions from personal aviation, reflecting that these lifestyles entail less foreign travel due to financial constraints. Conversely, Prospering Suburbs and Countryside have the highest emissions from personal aviation, reflecting their relative affluence. Constrained by Circumstances also stands out as the Supergroup that has the highest proportion of carbon due to direct household energy use. This indicates that lower income households are likely to use a higher proportion of their carbon footprint on what might be considered essential services such as home heating than more affluent households.
In the middle income groups CO2 emissions depend on other factors in addition to relative affluence. For example, households in City Living have a relatively low proportion of emissions due to direct household energy use and high proportion embedded in goods and services, reflecting the relative efficiency of direct energy consumption in urban living.
Implications
Our results suggest that policies should be tailored to target different segments of society.
Outputs
Druckman, A and T Jackson 2009. The carbon footprint of UK households 1990-2004: a socio-economically disaggregated, quasi-multiregional input-output model. Ecological Economics 68 (7): 2066–2077.
Druckman, A and T Jackson 2008. Household energy consumption in the UK: a highly geographically and socio-economically disaggregated model. Energy Policy 36 (8): 3167– 3182.